A continuity is a continuous function that is predictable and can be drawn continuously,without lifting your pencil and has no breaks, no holes, and or jumps.If in a function the limit and the value are the same, it is continuous.
 |
| Here is an example of a continuous function that has no breaks no holes, no jumps, and can be drawn without removing the pencil. |
What is a discontinuity?
On the other hand a discontinuity does have these breaks, holes,and jumps. In this case there are two families of discontinuities, Removable Discontinuities and Non- Removable Discontinuities.A discontinuity happens when the intended height of a function and the actual height of a function are different. This can result in one of three different discontinuities, either jump, infinite, or oscillating. A jump discontinuity is when there is a jump between two points that has caused a difference between left/right values. Secondly, is the oscillating discontinuity,which is a function whose graph continuously switches between increasing and decreasing causing the graph to have a series of local maxima and minima resembling waves in water or a vibrating string. The last discontinuity is an infinite discontinuity which is caused by a vertical asymptote which then results in unbounded behavior.
Jump Ex.
 |
| (Example of a jump discontinuity, as you can see there is a jump between 2 points and comes in from one on the left but is different right) |
Oscillating Ex:
 |
| (Example of an oscillating discontinuity) |
 |
| (Example of an infinite discontinuity which as you can see has a vertical asymptote which results in unbounded behavior) |
A limit is the intended height of a function. A limit will exist as long as you can reach the same height from both the left and the right. A limit does not exist if the left and right hand limits are not equal, this can usually be caused by breaks, jumps, or holes in the graph and function(hence discontinuities). A limit is the intended height of a function while a value is the actual height of a function.
 |
| (Example of an existing limit, since both the value and the limit are the same from left and right.) Ex of a function without a limit |
 |
| This is an example of a limit NOT existing, as you can see we start from different sides but unlike the previous picture, we don't end up at the same place in the middle, instead there is a "jump discontinuity") |
3. How do we evaluate limits numerically, graphically, and algebraically?
There are many ways to evaluate limits, I will be focusing on three specific ways of evaluating them, those three being numerically, graphically, and algebraically. Numerically, we evaluate limits using tables which help us to determine the "x" and the "f(x)", which are the intended and actual height of a function.
Evaluating limit algebraically:
The first way of evaluating the limit is by doing it algebraically. To do this you start by plugging the limit that is given into the function itself, substituting the x with the limit. All you would need then is the limit and the function to evaluate the limit this way. The following picture shows an example of this being done in a step by step process.
 |
(This picture shows a limit being evaluated algebraically)
|
Evaluating a limit Numerically:
While multiple ways to evaluate limits, we will be focusing on three specific ways of evaluating them, those three being numerically, graphically, and algebraically. Numerically, we evaluate limits using tables which help us to determine the "x" and the "f(x)", which are the intended and actual height of a function. An example can be shown in the below picture.
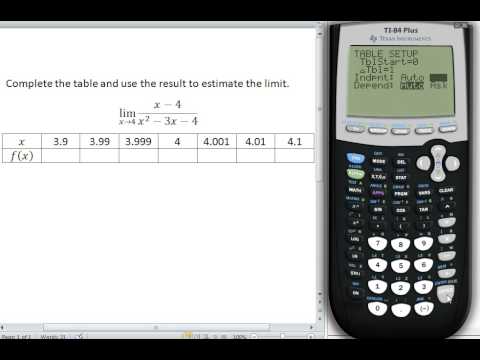 |
| (This picture shows a limit being evaluated numerically) |
Evaluating limits can also be done graphically. There are many ways to do it graphically but there are two main ways, those being having a picture of a graph and using your fingers, the other way is using a graphing calculator by plugging in the equation of the function. The following picture shows doing it by plugging in the equation of the function into your graphing calculator.
 |
| (this image shows the process to graphing limits) |